Deploying the stack in an AWS account – Enabling the Observability of Your Workloads
- Blog
- Deploying the stack in an AWS account – Enabling the Observability of Your Workloads
At this point, we can deploy our CDK stack in the AWS account. Alongside core infrastructure elements such as VPCs, subnets, and gateways, it will provision the ECS cluster, which contains three containers – the application, the database, and the OpenTelemetry collector. We will also deploy an independent workspace for Amazon-managed Prometheus. Toward the end, we will deploy Grafana manually since it is not supported for deployment via CDK at the time of writing.
Rolling out the CDK stack
First and foremost, let’s start a new session for the Cloud9 IDE and switch to the directory that contains the resources for this chapter.
Once we are inside the CDK project folder for this chapter, we can use the npm install command to download all the node modules. After the installation completes, we can trigger cdk synth to get a high-level understanding of the CloudFormation template that is going to be deployed in our AWS account:
aws-devops-simplified:~/environment/chapter-8/chapter-8-cdk $ cdksynthResources:CustomVPC616E3387:Type: AWS::EC2::VPCProperties:CidrBlock: 10.0.0.0/16EnableDnsHostnames: trueEnableDnsSupport: trueInstanceTenancy: defaultTags:- Key: NameValue: Chapter8CdkStack/CustomVPCMetadata:……
Once you have taken a quick look at the template and understood the resources that are being provisioned, you can proceed with the final stack deployment:
aws-devops-simplified:~/environment/chapter-8/chapter-8-cdk $ cdkdeploySynthesis time: 11.93sChapter8CdkStack: building assets…
After the CDK stack deployment completes, we will get the load balancer URL as an output on the screen. This can be used to access the application in a browser. We will use the same URL to generate some load so that we see some metrics and data being pushed to different components of our observability stack. But before that, let’s configure the Grafana dashboard so that it’s ready to consume metrics from Prometheus.
Creating a workspace for Amazon Managed Grafana
AWS’s official documentation outlines all the steps you need to perform to set up a personal Grafana workspace in your account, using the web console. To ensure that you are following the up-to-date instructions, I suggest going through the official link at https://docs.aws.amazon.com/ grafana/latest/userguide/AMG-create-workspace.html. Please ensure that youare using the same AWS region where you deployed your CDK stack. Grafana configures user access via SSO or SAML. If you are new to both these concepts, I recommend setting up an AWS SSO user in your account. It’s free of cost and at the same time gives you a secure mechanism to govern access to multiple AWS accounts in your organization, from one central panel.
For data sources, we need to select Amazon Managed Service for Prometheus.
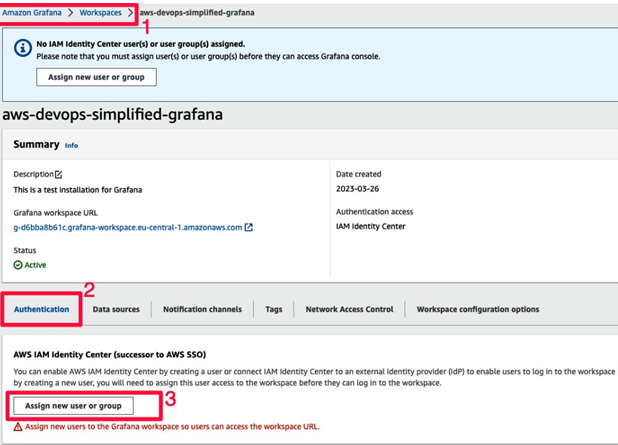
After the installation is complete, you can proceed to the user administration section for the Grafana workspace. You can follow the steps shown in Figure 8.4 and assign the SSO/SAML user you have configured as the admin for this Grafana installation:

Figure 8.4 – Assigning an admin user for the Grafana workspace
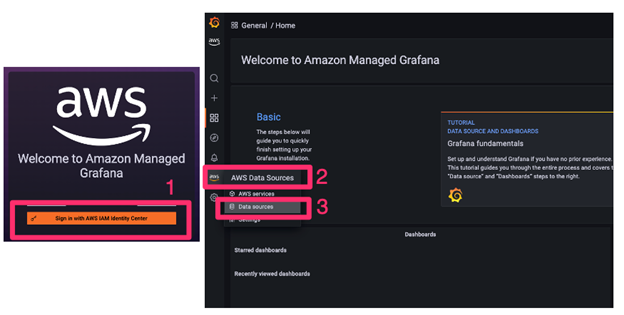
Once you’ve added an admin user for your new Grafana workspace, you can proceed to the login page, enter the necessary credentials, and follow the data source configurations, as shown in Figure 8.5. This will allow Grafana to query metrics from the Prometheus workspace that was created as part of the CDK deployment:

Figure 8.5 – Grafana login and data source configuration
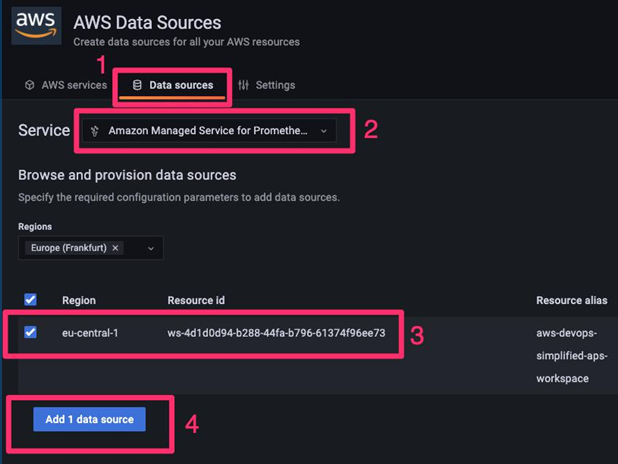
This option leads to the data source configuration page, where you can add additional details of the Prometheus workspace you want to integrate with. Assuming that you haven’t created any other workspace in the same account, you will find the one that was provisioned by the CDK stack, after you select the appropriate AWS region, which in our case is always eu-central-1, or Frankfurt.
If you see multiple workspaces, please reference the identifier for the one that was created as part of the CDK deployment. This should be available on the recently deployed CloudFormation stack details page.
Once you’ve filled in all the data source configuration fields for Prometheus, you should see something similar to the following:

Figure 8.6 – Data source configurations for the Prometheus connector
At this point, Grafana will start pulling metrics from the Prometheus server and make it available to you as a visualization in the dashboard.
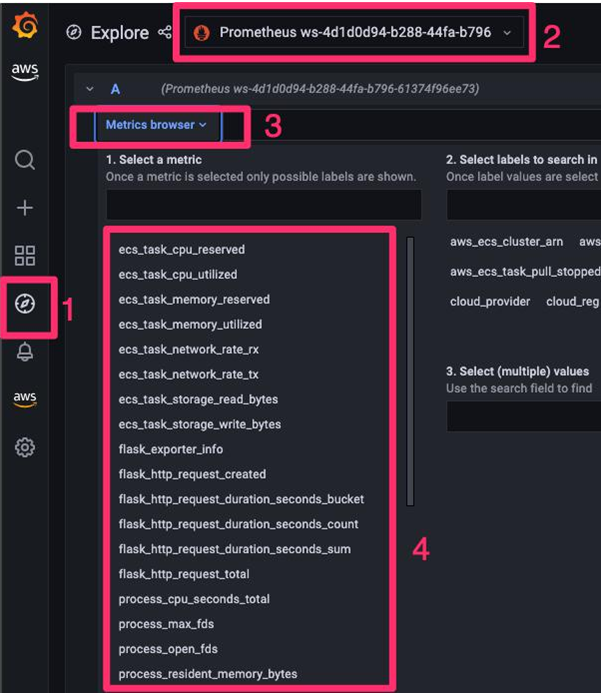
As shown in Figure 8.7, you will see the following categories of metrics for selection:

Figure 8.7 – Prometheus selectors for different categories of metrics
Once you’ve selected the metrics as per your choice, you need to induce load on our web application so that you can start seeing relevant telemetry data across different platforms and tools.
© Copyright 2024 morningfun.org