Insights and operational visibility – Enabling the Observability of Your Workloads
- Blog
- Insights and operational visibility – Enabling the Observability of Your Workloads
This category of offeringsis a huge differentiator when it comes to providing ready- made solutions that extract data from multiple sources and deriving insights out of those to provide actionable next steps to the user.
Container insights
When working with AWS services in the container landscape, you can use CloudWatch container insights to summarize metrics and logs from your containerized applications. It offers deep insightsinto problems such as continuous container restarts, for example.
Lambda Insights
When running serverless workloads on AWS Lambda, Lambda Insights can offer a deep understanding of system-level metrics and events from your Lambda invocations. For supported runtimes, you can add an extension that starts gathering useful data and helps the users identify problems such as cold starts.
Did you know?
At the time of writing, Amazon CloudWatch is used to monitor more than 9 quadrillion metric observations and ingests more than 5 exabytes of logs per month. Comparing this with over 8 billion people on Earth would mean that the service manages roughly 1 million events per person on the planet, per month. That’s the scale CloudWatch operates at.
There is so much that users can do by leveraging the right solutions from the CloudWatch observability platform. However, there are some best practices that I would like to discuss next so that you can maximize your benefits when using these tools.
Best practices for a solid observability strategy
In this section, we will be covering some fundamentals of how to best represent your observability data while maintaining the right balance of information you need to process.
Build a hierarchy of dashboards
A key measure of success for your observability strategy is the Mean Time to Recover (MTTR). This defines how soon an engineer working on operational issues can understand and recover from the underlying problem. To begin with, it’s important to have dashboards that provide just the right amount of detail. Reducing unwanted noise is crucial in reducing the overall MTTR. A common problem software teams run into is creating a data-heavy dashboard that covers many different aspects of their application, all on one screen. This often leads to false negatives consuming a lot of investigation time.
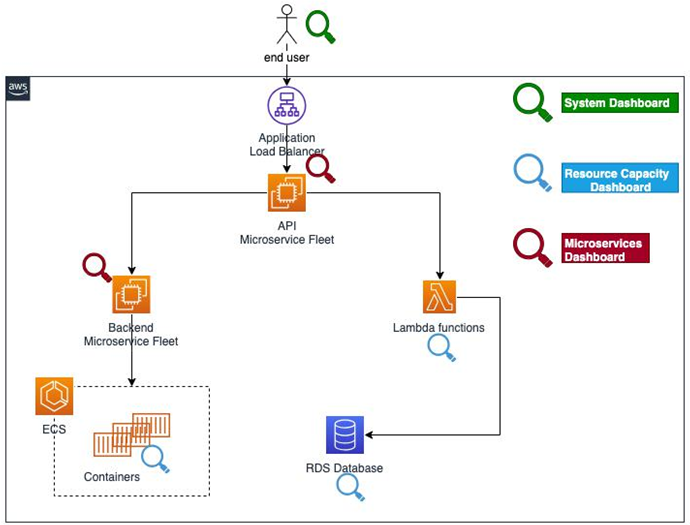
As outlined at the beginning of this chapter, you must build your observability strategy while keeping your customer in mind and empathizing with them. To have a feel of what they are experiencing as an end user, you can build a hierarchy of dashboards that starts with the top-level global view and has links to other child dashboards as you dive deeper into each component. Each of these child dashboards caters to a specific design domain of your application. As an example, let’s consider a typical web application architecture that’s implemented with several microservices. After starting with a high-level dashboard that provides latency for important APIs, service map health, and distributed tracing data, you can narrow down your investigation scope to specific dashboards that provide more detail about the frontend, application, or data tier. This allows you to focus on just enough information and move further into the investigation, one step at a time. Additionally, you could implement a global dashboard that highlights resource capacity issues for all the components and corresponding resources. Figure 8.1 highlights the specific areas of your architectures these dashboards could focus on:

Figure 8.1 – Building the right hierarchy of dashboards to reduce MTTR
A lot of practices can further simplify or enhance the data represented by dashboards. Let’s go through some of them.
© Copyright 2024 morningfun.org