Instrumenting application metrics with Amazon Managed Prometheus – Enabling the Observability of Your Workloads
- Blog
- Instrumenting application metrics with Amazon Managed Prometheus – Enabling the Observability of Your Workloads
As discussed previously, instantiating the Prometheus client inside our Flask application additionally enabled a /metrics endpoint that exposed application metrics to scrapers – in our case, the OTEL collector.
You can also look at these raw metrics by hitting the application load balancer URL, with the /metrics suffix at the end.
In my case, accessing the http://chapt-farga-65sza285ppo1-1511829492.eu-central-1.elb.amazonaws.com/metrics URL gave me the following output:
flask_exporter_info{version=”0.22.3″} 1.0 …
flask_http_request_duration_seconds_ bucket{le=”0.005″,method=”GET”,path=”/”,status=”200″} 309.0…
The lines starting with # HELP describe some information about the following lines and how to interpret them, while the ones starting with # TYPE show the type of metric (histogram/gauge) and the related values that can then be visualized by tools such as Grafana.
Visualizing data with Amazon Grafana
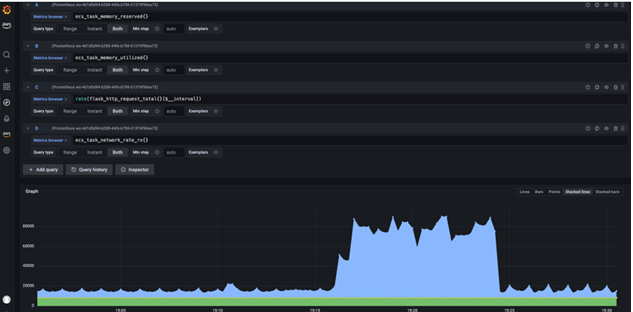
So far, we have validated that the application is exposing metrics data on the /metrics endpoint and that the OTEL collector is scraping this endpoint and further publishing it in the Prometheus workspace we provisioned in our CDK stack. The final tool in our architecture was Grafana. As described in Figure 8.7, you can select certain metrics to be shown on the Grafana dashboard. I selected a few of those and got the following screenshot (Figure 8.9), which highlights the network request spikes that lasted for some time while the curl command was running in the background:

Figure 8.9 – Visualizing metrics on the Amazon Grafana dashboard
Ideally, you would customize the field selectors based on the key metrics that define your system behavior and also pin them to a dashboard that can be continuously monitored.
Summary
Developing software applications is only one part of the challenge. Maintaining them in a productive environment (at an enterprise scale) requires equal commitment and engineering effort. This can only be achieved with a solid observability strategy that allows you to not only react faster to operational issues but also gather meaningful insights that allow you to continue delivering differentiated business outcomes to your users.
We started this chapter with a basic understanding of what observability is and why it matters. Equipped with that knowledge, we then moved on to discussing the AWS observability platform – CloudWatch– and the solutions or integrations it offers for each of the observability pillars – metrics, logs, and traces. In addition to that, we discussed AWS’s efforts in the CNCF’s Open Telemetry project and the ADOT collector, which allows you to seamlessly collect, process, and export metrics, logs, and traces to other AWS services.
Outside AWS, solutions such as Prometheus and Grafana are widely adopted by companies due to their maturity, ease of use, and scalability. To ensure a hands-on experience that covers all these solutions, we went ahead with deploying an observability stack for the To-Do List Manager, our test application from the previous chapter. This allowed us to have a holistic view of how we can integrate all these tools and adapt them to our specific needs.
In the next chapter, Implementing DevSecOps with AWS, we will focus on an approach that enables us to integrate security throughout the entire IT life cycle.
Further reading
To learn more about the topics that were covered in this chapter, take a look at the following resources:
© Copyright 2024 morningfun.org