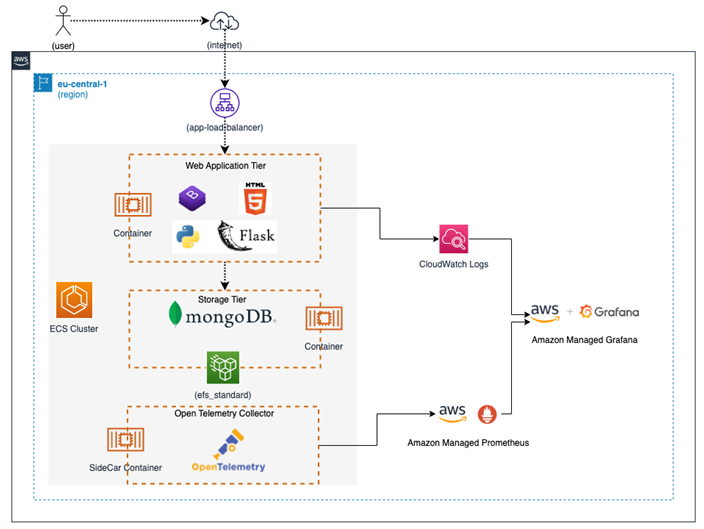
Overview of the target architecture – Enabling the Observability of Your Workloads
- Blog
- Overview of the target architecture – Enabling the Observability of Your Workloads
Before we dive into the code-level changes, let’s get a visual understanding of the components we plan to add around our test application stack, and how they communicate with each other. We will focus on capabilities that help us monitor the application logs and metrics on tools of our choice.
We will extend our existing application architecture with the following components to capture and display observability data:
All these components and the corresponding information flows are highlighted in Figure 8.3. In this case, the Flask-based web application forwards logs to the CloudWatch Logs service. The application metrics are scraped by the OpenTelemetry sidecar container and then forwarded to the Amazon Managed Prometheus (AMP) service. Finally, we configure Amazon Managed Grafana to querydata from both these sources and display it in a centralized dashboard:

Figure 8.3 – Observability stack for the To-Do List Manager test application
Note
If you have been exposed to Prometheus tooling in the past, you would have typically experienced a pull-based approach where the Prometheus server fetches the metrics directly from the relevant targets and stores them. In this case, however, we are using the OTEL collector sidecar pattern from AWS, which pushes the metrics to the Amazon Managed Prometheus workspace after scraping the application endpoints.
As a next step, let’s get our hands dirty with some code-level modifications to realize the architecture we just discussed.
© Copyright 2024 morningfun.org